#HIDDEN
import sys
#!pip install git+https://github.com/DBertazioli/folium.git --user
#!pip  uninstall -y folium;
try:
    import folium
except:
    print("hello")
    #!{sys.executable} -m pip  uninstall -y folium;
    #!{sys.executable} -m pip install folium
    #import folium

#!{sys.executable} -m pip install --user git+https://github.com/DBertazioli/folium.git
#!{sys.executable} -m pip install --user git+https://github.com/DBertazioli/folium
#!{sys.executable} -m pip install --user  -e git+https://github.com/DBertazioli/folium.git@master#egg=folium
#!source activate py36;pip install folium --user
#!pip install --user -e git+https://github.com/DBertazioli/folium.git@master#egg=folium

import os
import pandas as pd
import numpy as np
import datetime

try:
    import branca
except:
    print("hi")
    !{sys.executable} -m pip install branca
    import branca

import base64 #jpeg encoding


#import folium
from folium import plugins
from folium.plugins import MarkerCluster
from folium.features import DivIcon, FeatureGroup
from folium import IFrame
import branca #brrr
Esplora la mappa
Benvenuto nella nostra mappa interattiva basata sui dati raccolti dalle risposte degli utenti agli eventi Meetup. Premi il tasto Show Widgets per avviare la visualizzazione. Non importa se premerai quello superiore o quello inferiore, il risultato sarà lo stesso.
NB
Il caricamento della mappa potrebbe richiedere anche alcuni minuti, dipendentemente dal traffico.
Non scoraggiarti, cogli l'occasione per leggere le istruzioni.
Cosa posso vedere?
Potrai esplorare la mappa europea osservando, per ogni ogni paese, gli eventi che si sono tenuti nella capitale (fatta eccezione per l'Italia, per cui oltre a Roma è disponibile anche Milano). Sarà così per te possibile visualizzare a colpo d'occhio la numerosità degli eventi da noi rilevati in uno streaming della durata di appena due settimane.
Davvero si sono tenuti così pochi eventi ?
Assolutamente no. Gli eventi in nostro possesso, per quanto riguarda il territorio europeo, si aggirano su una cifra che supera le 50 mila unità. Putroppo però per limiti computazionali dovuti alla potenza "free" offerta da mybinder.com (scelta obbligata per evitare che gli utenti della visualizzazione fossero costretti ad eseguire personalmente il notebook) e per poter rendere l'esplorazione il più fluida possibile, abbiamo deciso di limitare la visualizzazione solamente a quegli eventi che avessero raggiunto, durante lo streaming, un certo quantitativo di partecipanti.
Come posso accedere ai contenuti ?
Esplorare i contenuti è molto semplice, ti basta infatti premere sull'apposito widget:
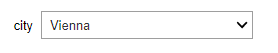
Quando avrai interagito con il menù a tendina ti si presenterà la scelta della città da selezionare:
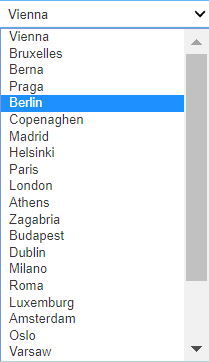
NB
- Più la città è grande, più numerosi saranno gli eventi in essa rappresentati. Questo potrebbe comportare un dilatarsi del tempo di attesa.
- Al fondo del menù a tendina è disponibile la modalità Europe, ovvero la possibilità di visualizzare tutti gli eventi in un colpo solo, senza discriminare per città. La scelta di questa opzione potrebbe comportare tempi di attesa decisamente più lunghi rispetto alla scelta della singola città.
Nel caso scegliessi comunque di visualizzare tutti gli eventi attraverso la modalità Europe, da vero temerario, per ogni Paese sarà disponibile un puntatore nero diverso da quello utilizzato per rappresentare gli eventi. Interangendo con questo puntatore potrai accedere a delle visualizzazioni riassuntive riguardo gli eventi di quel Paese. Nel caso fossi interessato soltanto a questi puntatori riassuntivi, dopo aver selezionato la modalità Europe ed aver atteso il caricamento della visualizzazione, potrai interagire con un altro widget, presente nella mappa, in basso a sinistra:

Una volta selezionato ti basterà deselezionare la voce riguardante gli eventi ed a questo punto disporrai solamente dei puntatori relativi alle informazioni riassuntive per ogni Paese.
A questo punto non ti resta altro da fare che selezionare la voce di interesse ed esplorare liberamente.
#HIDDEN
# ## Data Prep
#to change leaflet.css: https://codepen.io/dbertazioli/pen/LoBmKo.css
#remember to save
## Let's build a map
template_old = """
{% macro html(this, kwargs) %}
<!doctype html>
<html lang="en">
<head>
<meta charset="utf-8">
<meta name="viewport" content="width=device-width, initial-scale=1">
<title>jQuery UI Draggable - Default functionality</title>
<link rel="stylesheet" href="//code.jquery.com/ui/1.12.1/themes/base/jquery-ui.css">
<script src="https://code.jquery.com/jquery-1.12.4.js"></script>
<script src="https://code.jquery.com/ui/1.12.1/jquery-ui.js"></script>
<script>
$( function() {
$( "#maplegend" ).draggable({
start: function (event, ui) {
$(this).css({
right: "auto",
top: "auto",
bottom: "auto"
});
}
});
});
</script>
</head>
<body>
<div id='maplegend' class='maplegend'
style='position: fixed; z-index:9999; border:2px solid grey; background-color:rgba(255, 255, 255, 0.8);
border-radius:6px; padding: 10px; font-size:14px; right: 20px; bottom: 20px;'>
<div class='legend-title'>Legend (draggable!)</div>
<div class='legend-scale'>
<ul class='legend-labels'>
<li><span style='background:red;opacity:0.7;'></span>Bacino d'utenza</li>
<!-- questo è un commento <li><span style='background:orange;opacity:0.7;'></span>Medium</li>
<li><span style='background:green;opacity:0.7;'></span>Small</li> -->
</ul>
</div>
</div>
</body>
</html>
<style type='text/css'>
.maplegend .legend-title {
text-align: left;
margin-bottom: 5px;
font-weight: bold;
font-size: 90%;
}
.maplegend .legend-scale ul {
margin: 0;
margin-bottom: 5px;
padding: 0;
float: left;
list-style: none;
}
.maplegend .legend-scale ul li {
font-size: 80%;
list-style: none;
margin-left: 0;
line-height: 18px;
margin-bottom: 2px;
}
.maplegend ul.legend-labels li span {
display: block;
float: left;
height: 16px;
width: 30px;
margin-right: 5px;
margin-left: 0;
border: 1px solid #999;
}
.maplegend .legend-source {
font-size: 80%;
color: #777;
clear: both;
}
.maplegend a {
color: #777;
}
</style>
{% endmacro %}"""
template = """
{% macro html(this, kwargs) %}
<!doctype html>
<html lang="en">
<head>
<meta charset="utf-8">
<meta name="viewport" content="width=device-width, initial-scale=1">
<title>jQuery UI Draggable - Default functionality</title>
<link href="https://fonts.googleapis.com/css?family=Montserrat:200,400,600,700,800&display=swap" rel="stylesheet">
<script src="https://code.jquery.com/jquery-1.12.4.js"></script>
<script src="https://code.jquery.com/ui/1.12.1/jquery-ui.js"></script>
<script>
$( function() {
$( "#maplegend" ).draggable({
start: function (event, ui) {
$(this).css({
right: "auto",
top: "auto",
bottom: "auto"
});
}
});
});
</script>
</head>
<body>
<div id='maplegend' class='maplegend'
style='font-family:'Montserrat', sans-serif;position: fixed; z-index:9999; border:2px solid grey; background-color:rgba(36, 41, 46, 0.9);
border-radius:6px; padding: 10px; font-size:14px; right: 20px; bottom: 20px;'>
<div class='legend-title'>Legend (draggable!)</div>
<div class='legend-scale'>
<ul class='legend-labels'>
<li><span style='background:red;opacity:0.7;'></span>Area d'influenza</li>
<!-- questo è un commento <li><span style='background:orange;opacity:0.7;'></span>Medium</li>
<li><span style='background:green;opacity:0.7;'></span>Small</li> -->
</ul>
</div>
</div>
</body>
</html>
<style type='text/css'>
.maplegend .legend-title {
font-family: 'Montserrat', sans-serif;
text-align: left;
margin-bottom: 5px;
font-weight: 900;
font-size: 90%;
color:#f64060;
}
.maplegend .legend-scale ul {
margin: 0;
margin-bottom: 5px;
padding: 0;
float: left;
list-style: none;
}
.maplegend .legend-scale ul li {
font-family: 'Montserrat', sans-serif;
font-size: 80%;
list-style: none;
margin-left: 0;
line-height: 18px;
margin-bottom: 2px;
}
.maplegend ul.legend-labels li span {
display: block;
float: left;
height: 16px;
width: 30px;
margin-right: 5px;
margin-left: 0;
border: 1px solid #999;
}
.maplegend .legend-source {
font-family: 'Montserrat', sans-serif;
font-size: 80%;
color: #777;
clear: both;
}
.maplegend a {
color: #777;
}
</style>
<style>
.leaflet-popup-content-wrapper,
.leaflet-popup-tip {
background: #24292E;
color: #24292E;
box-shadow: 0 3px 14px rgba(0,0,0,0.4);
}
</style>
{% endmacro %}"""
html = """
<h3> Event ID : </h3><p>{}</p>
<h3> Event Name: </h3><p></p>
<h3> Location: </h3><p>{}</p>
"""
html1 = """
<h2> Welcome to the meetup event map! </h2>
<h3> Some tips: </h3><p>{}</p>
<h3> Some other tips: </h3><p>{}</p>
"""
html2_old = """
<div style="
font-family: 'Montserrat', sans-serif;
font-weight: 800;
position: fixed;
bottom: 5px;
left: 10px;
width: 300px;
height: 330px;
z-index:9999;
font-size:16px;
color:#f64060;">
<h4> Event ID : <a style="color:#dde072;font-size:70%;">{}</a></h4>
<h4> Event Data: </h4><p><a style="color:#dde072;font-size:100%;font-weight:400;">{}</a></p>
<h4> Location: </h4><p><a style="color:#dde072;font-size:100%;font-size:100%;font-weight:400;">{}</a></p>
<h4> Event {} : </h4><p><a style="color:#dde072;font-size:100%;font-size:100%;font-weight:400;">{}</a></p>
<h4> Participants: <a style="color:#dde072;font-size:80%;">{}</a></h4>
<h5> Area of Influence Radius (median): <a style="color:#dde072;font-size:95%;">{} Km</a> </h5>
</div>
<div style="
font-family: 'Montserrat', sans-serif;
position: fixed;
bottom: -5px;
left: -5px;
width: 300px;
height: 340px;
z-index:9998;
font-size:14px;
background-color: #5c5c5c;
filter: blur(0.5px);
-webkit-filter: blur(0.5px);
opacity: 0.95;
border-radius:8px;
">
</div>
"""
html2 = """
<div style="
font-family: 'Montserrat', sans-serif;
font-weight:bold;
position: fixed;
bottom: 15px;
left: 5px;
width: 300px;
height: 330px;
z-index:9999;
font-size:17px;
font-variant:small-caps;
color:#b9cddf;
font-size-adjust:0.6;">
<h5> Event ID: <a style="color:#f75572;font-size:100%;font-family: 'Montserrat', sans-serif;font-weight:lighter">{}</a></h5>
<br>
<h4> Event Data: </h4><p><a style="color:#f75572;font-size:80%;font-family: 'Montserrat', sans-serif;font-weight:lighter">{}</a></p>
<h4> Location: </h4><p><a style="color:#f75572;font-size:80%;font-family: 'Montserrat', sans-serif;font-weight:lighter">{}</a></p>
<h4> Event {}: </h4><p><a style="color:#f75572;font-size:80%;font-family: 'Montserrat', sans-serif;font-weight:lighter">{}</a></p>
<h5> Participants: <a style="color:#f75572;font-size:100%;font-family: 'Montserrat', sans-serif;font-weight:lighter">{}</a></h5>
<h5> Area of Influence Radius (median): <a style="color:#f75572;font-size:100%;font-family: 'Montserrat', sans-serif;font-weight:lighter">{}Km</a> </h5>
</div>
<div style="
font-family: 'Montserrat', sans-serif;
position: fixed;
bottom: -5px;
left: -5px;
width: 320px;
height: 350px;
z-index:9998;
font-size:14px;
background-color: #182534;
filter: blur(0.5px);
-webkit-filter: blur(0.5px);
opacity: 0.95;
border-radius:8px;
">
</div>
"""
title="""
<div style="
font-family: 'Montserrat', sans-serif;
font-weight: 800;
position: fixed;
top: 5px;
width: 350px;
height: 300px;
z-index:9999;
font-size:16px;
color:#f64060;">
<center><h1> {}: <a style="color:#dde072;font-size:70%;">{}</a></h1></center>
</div>
"""
legend_html = """
<div style=”position: fixed;
bottom: 50px; left: 50px; width: 100px; height: 90px;
border:2px solid grey; z-index:9999; font-size:14px;
“> Cool Legend <br>
East <i class=”fa fa-map-marker fa-2x”
style=”color:green”></i><br>
West <i class=”fa fa-map-marker fa-2x”
style=”color:red”></i>
</div>
"""
legend_html2_OLD = '''
<div style="
position: fixed;
bottom: 45px;
right: 10px;
width: 275px;
height: 40px;
z-index:9999;
font-size:14px;
">
<center><p style= "color:#dde072; font-size:110%" ><a style="color:#f64060;font-size:130%;margin-left:1px;">🔴</a> Area of Inflence (median)</p></center>
<center><p style= "color:#dde072;font-size:110%"><a style="color:#f64060;font-size:170%;margin-left:17px;">⭕</a> Area of Influence (3rd quartile)</p></center>
</div>
<div style="
position: fixed;
bottom: -2px;
right: -2px;
width: 275px;
height: 90px;
z-index:9998;
font-size:14px;
background-color: #5c5c5c;
filter: blur(0.5px);
-webkit-filter: blur(0.5px);
opacity: 0.9;
border-radius:8px;
">
</div>
'''
legend_html2 = '''
<div style="
position: fixed;
bottom: 30px;
right: 10px;
width: 275px;
height: 40px;
z-index:9999;
font-size:14px;
font-size-adjust:0.6;
">
<center><p style= "color:#b9cddf;font-variant:small-caps;font-family: 'Montserrat', sans-serif;font-size:90%" ><a style="color:#f64060;font-size:90%;margin-left:1px;">🔴</a> Area of Influence (median)</p></center>
<center><p style= "color:#b9cddf;font-variant:small-caps;font-family: 'Montserrat', sans-serif;font-size:90%"><a style="color:#f64060;font-size:120%;margin-left:17px;">⭕</a> Area of Influence (3rd quartile)</p></center>
</div>
<div style="
position: fixed;
bottom: -2px;
right: -2px;
width: 275px;
height: 90px;
z-index:9998;
font-size:14px;
background-color: #182534;
filter: blur(0.5px);
-webkit-filter: blur(0.5px);
opacity: 0.9;
border-radius:8px;
">
</div>
'''
#html_file = open('widget.html','r')
#html_file=html_file.read()
#html_file
def zoom_on_radius(radius):
if radius >=10000:
return 2
if (radius >=1000 and radius <10000):
return 3
if (radius >= 500 and radius<1000):
return 5
if (radius >= 100 and radius<5000):
return 6
if (radius >= 50 and radius<100):
return 8
else:
return 10
ddrop=pd.read_csv("https://raw.githubusercontent.com/DBertazioli/Interact/master/data/map_df.csv")
country_list=list(ddrop.Country.unique())
#HIDDEN

capitals={
    'fr':"Paris",
    'es':"Madrid",
    'gb':"London",
    'nl':"Amsterdam",
    'se':"Stockholm",
    'de':"Berlin",
    'cz':"Praga",
    'pl':"Varsaw",
    'ie':"Dublin",
    'be':"Bruxelles",
    'lu':"Luxemburg",
    'no':"Oslo",
    'hu':"Budapest",
    'dk':"Copenaghen",
    'ch':"Berna",
    'it_Milano':"Milano",
    'at':"Vienna",
    'fi':"Helsinki",
    'pt':"Porto",
    'ro':"Bucarest",
    'gr':"Athens",
    'ua':"Kiev",
    'hr':"Zagabria",
    'it_Roma':"Roma"
}
pop={
    'fr':2141000,
    'es':3174000,
    'gb':8136000,
    'nl':821752,
    'se':965232,
    'de':3575000,
    'cz':1281000,
    'pl':1765000,
    'ie':544107,
    'be':174383,
    'lu':114303,
    'no':634293,
    'hu':1756000,
    'dk':602481,
    'ch':133115,
    'it_Milano':1352000,
    'at':1868000,
    'fi':631695,
    'pt':504718,
    'ro':1836000,
    'gr':3074160,
    'it_Roma':2865000,
    'ua':2884000,
    'hr':792875
}
capital_list=[]

for country in country_list:
    try:
        capital_list.append(capitals[country])
    except:
        pass
#print(country_list)
#print(capital_list)
capital_list.append("Europe")
#HIDDEN
count_df=pd.read_csv("https://raw.githubusercontent.com/DBertazioli/NBinteract/master/count_df.csv")
#ddrop=pd.read_csv("https://raw.githubusercontent.com/DBertazioli/NBinteract/master/map_df.csv")

coord_dict={
    "fr":[48.864716,2.349014],
"es":[40.416775, -3.703790],
"gb":[51.50, -0.12],
"nl":[52.370216,4.895168],
"se":[59.33, 18.07],
"de":[52.520008,13.404954],
"pt":[41.14961, -8.61099],
"fi":[60.192059,24.945831],
"it_Roma":[41.9, 12.48]
}
#HIDDEN
from ipywidgets import interact

capital_list.sort()
#count_df=pd.read_csv("https://raw.githubusercontent.com/DBertazioli/NBinteract/master/count_df.csv")
#ddrop=pd.read_csv("https://raw.githubusercontent.com/DBertazioli/NBinteract/master/map_df.csv")
@interact(city=capital_list)
def show_canned_examples(city):
    print("loading data...")
    for key, value in capitals.items():
        if value == city:
            country=key

    #aggr_icon=folium.Icon(color='gray',icon="info-sign")#, prefix="fa")#'info-sign')
    #https://fontawesome.com/icons?d=gallery
    #event_icon=folium.Icon(color='darkred',icon="group", prefix="fa")
    #event_icon=folium.Icon(color='darkred')
    dict_country_hm={"it_Roma":"Italy","se":"Sweden", "gb":"Great Britain", "fi":"Finland", "fr":"France", "es":"Spain", "pt":"Portugal", "de":"Germany", "nl":"Netherlands"}
    if city!="Europe":
        #for capitals[country] in city :
        #print(ddrop[ddrop['Country']==country]['v_lat'].mean(),ddrop[ddrop['Country']==country]['v_lon'].mean())
        m = folium.Map(location=[float(ddrop[ddrop['Country']==country]['v_lat'].mean()),float(ddrop[ddrop['Country']==country]['v_lon'].mean())], zoom_start=4, min_zoom=2)
        mc=MarkerCluster( name="yay"
            #icon_create_function=icon_create_function
        )
        radius_events = FeatureGroup(name='Display Events')

        if country in dict_country_hm.keys():
            heat_events= FeatureGroup(name='Display Info')
            string='<center><h1><a style="color:#b9cddf;font-size:100%;">{}{}</a></h1></center>'.format("Aggregate info of ",dict_country_hm[country])
            string1='<center><img src="data:image/jpg;base64,{}"><center>'
            fig=string+string1
            encoded = base64.b64encode(open("heatmaps/complete_heatmap_"+country+".jpg", 'rb').read())#.decode()
            #html4 = '<center><img src="data:image/jpg;base64,{}"><center>'.format
            html4 = fig.format

            f1 = branca.element.Figure()
            #f1.html.add_child(branca.element.Element('<center><h1>{}<a style="color:#e6194b;font-size:100%;">{}</a></h1></center>'.format("Aggregate info of ",country)))
            #f1.html.add_child(branca.element.Element(title.format("Aggregate info of ",country)))
            iframe = IFrame(html4(encoded.decode('UTF-8')), width=1200, height=1000)
            h_popup = folium.Popup(iframe, max_width=2650)
            heat_events.add_child(
                    folium.Marker(
                    location = coord_dict[country],#[float(ddrop[ddrop['Country']==country]['v_lat'].mean()),float(ddrop[ddrop['Country']==country]['v_lon'].mean())],
                    popup=h_popup,
                    icon=folium.Icon(color="gray")
                    )
                ).add_to(m)
            f1.add_to(iframe)

        for line in ddrop.itertuples():
            if line.Country==country:


                lat=line.v_lat
                lon=line.v_lon

                mediandist=line.mediandist
                maxdist=line.maxdist

                f = branca.element.Figure()

                m1=folium.Map([float(lat), float(lon)], zoom_start=zoom_on_radius(maxdist), min_zoom=2) #eventualmente aggiungere il livello di zoom in base al raggio può essere fyco

                Topic=", ".join(str(line.topic).split(","))

                '''#enable for info in popup
                iframe = branca.element.IFrame(
                    html=html.format(ddrop['ID_event'].at[line.Index], ddrop['venue_name'].at[line.Index], Topic),
                    width=400, height=240
                )

                popup1 = folium.Popup(iframe, show=True)
                '''
                #f.html.add_child(branca.element.Element('<center><h3><a href="{}" target="_blank" style="color:#f64060;font-size:100%;">{}</a></h3></center>'.format(line.event_url,line.event_name)))#.encode("utf-8","surrogatepass").decode("unicode-escape", "ignore"))))
                #f.html.add_child(branca.element.Element(html_file))
                f.html.add_child(branca.element.Element('<center><h3><a href="{}" target="_blank" style="color:#f75572;font-size:120%;font-weight:bold;">{}</a></h3></center>'.format(line.event_url,line.event_name)))#.encode("utf-8","surrogatepass").decode("unicode-escape", "ignore"))))

                m1.add_child(folium.Circle(
                  location=[float(lat), float(lon)],
                  #popup=popup1,#uncomment for info in popup
                  #radius=int(ddrop.iloc[line.Index]['maxdist'])*1000,
                  radius=int(maxdist)*1000, #km->m
                  color='crimson',
                  fill=False,
                  fill_color='crimson',
                  fill_opacity=0.1,
                  weight=0.5
                ))

                m1.add_child(folium.Circle(
                  location=[float(lat), float(lon)],
                  #popup=popup1,
                  #radius=int(ddrop.iloc[line.Index]['maxdist'])*1000,
                  radius=int(mediandist)*1000, #km->m
                  color='crimson',
                  fill=True,
                  fill_color='crimson',
                  fill_opacity=0.2,
                  weight=0.1
                ))

                f.html.add_child(branca.element.Element(legend_html2))

                #html_now=html2.format(ddrop['ID_event'].at[line.Index], ddrop['venue_name'].at[line.Index], line.count_part)
                html_now=html2.format(line.ID_event, line.date, str(line.venue_name).encode().decode("unicode-escape", "replace"), "Topics", Topic, line.count_part,int(mediandist) )

                f.html.add_child(branca.element.Element(html_now))

                #f.add_child(legend)

                #f.html.add_child(branca.element.Element("<h1>Bacino d'utenza</h1>"))

                m1.add_to(f)

                iframe = branca.element.IFrame(html= '<body style= "background-color:#182534;"> </body>',width=1000, height=600)
                f.add_to(iframe)

                # Let's put the IFrame in a Popup
                popup = folium.Popup(iframe, max_width=2650)

                mc.add_child(
                    folium.Marker(
                    location = [float(lat), float(lon)],
                    popup=popup,
                    #color="darkred"
                    icon=folium.Icon(color="red",icon="fa-users", prefix="fa")#, size=(20,20))

                    ))
    else:
        print("loading the entire European map, it might take a while!")
        m = folium.Map(location=[float(ddrop['v_lat'].mean()),float(ddrop['v_lon'].mean())], zoom_start=4, min_zoom=2)
        mc=MarkerCluster()
        radius_events = FeatureGroup(name='Display_Events', show=False)
        heat_events= FeatureGroup(name='Display_Info')
        m.add_child(heat_events)
        for country in dict_country_hm.keys():

            string='<center><h1><a style="color:#b9cddf;font-size:100%;">{}{}</a></h1></center>'.format("Aggregate info of ",dict_country_hm[country])
            string1='<center><img src="data:image/jpg;base64,{}"><center>'
            fig=string+string1
            encoded = base64.b64encode(open("heatmaps/complete_heatmap_"+country+".jpg", 'rb').read())#.decode()
            #html4 = '<center><img src="data:image/jpg;base64,{}"><center>'.format
            html4 = fig.format

            #encoded = base64.b64encode(open("heatmaps/heatmap_"+country+".jpg", 'rb').read())#.decode()
            #html4 = '<center><img src="data:image/jpg;base64,{}"><center>'.format
            f1 = branca.element.Figure()
            iframe = IFrame(html4(encoded.decode('UTF-8')), width=1200, height=1000)
            #f1.html.add_child(branca.element.Element('<center><h1>{}<a style="color:#f64060;font-size:100%;">{}</a></h1></center>'.format("Country: ",country)))
            f1.add_to(iframe)

            h_popup = folium.Popup(iframe, max_width=2650)
            heat_events.add_child(
            folium.Marker(
                    location = coord_dict[country],#[float(ddrop[ddrop['Country']==country]['v_lat'].mean()),float(ddrop[ddrop['Country']==country]['v_lon'].mean())],
                    popup=h_popup,
                    icon=folium.Icon(color="gray")
                    )#.add_to(m)
            )
        heat_events.add_to(m)

        for line in ddrop.itertuples():

                lat=line.v_lat
                lon=line.v_lon

                mediandist=line.mediandist
                maxdist=line.maxdist

                f = branca.element.Figure()

                m1=folium.Map([float(lat), float(lon)], zoom_start=zoom_on_radius(maxdist), min_zoom=2) #eventualmente aggiungere il livello di zoom in base al raggio può essere fyco
                Topic=", ".join(str(line.topic).split(","))

                '''#enable for info in popup
                iframe = branca.element.IFrame(
                    html=html.format(ddrop['ID_event'].at[line.Index], ddrop['venue_name'].at[line.Index], Topic),
                    width=400, height=240
                )

                popup1 = folium.Popup(iframe, show=True)
                '''
                f.html.add_child(branca.element.Element('<center><h3><a href="{}" target="_blank" style="color:#f75572;font-size:120%;font-weight:bold;">{}</a></h3></center>'.format(line.event_url,line.event_name)))#.encode("utf-8","surrogatepass").decode("unicode-escape", "ignore"))))

                #f.html.add_child(branca.element.Element('<center><h3><a href="{}" target="_blank" style="color:#f64060;font-size:100%;">{}</a></h3></center>'.format(line.event_url,line.event_name)))#.encode("utf-8","surrogatepass").decode("unicode-escape", "ignore"))))
                #f.html.add_child(branca.element.Element(html_file))

                m1.add_child(folium.Circle(
                  location=[float(lat), float(lon)],
                  #popup=popup1,#uncomment for info in popup
                  #radius=int(ddrop.iloc[line.Index]['maxdist'])*1000,
                  radius=int(maxdist)*1000, #km->m
                  color='crimson',
                  fill=False,
                  fill_color='crimson',
                  fill_opacity=0.1,
                  weight=0.5
                ))

                m1.add_child(folium.Circle(
                  location=[float(lat), float(lon)],
                  #popup=popup1,
                  #radius=int(ddrop.iloc[line.Index]['maxdist'])*1000,
                  radius=int(mediandist)*1000, #km->m
                  color='crimson',
                  fill=True,
                  fill_color='crimson',
                  fill_opacity=0.2,
                  weight=0.1
                ))

                f.html.add_child(branca.element.Element(legend_html2))

                #html_now=html2.format(ddrop['ID_event'].at[line.Index], ddrop['venue_name'].at[line.Index], line.count_part)
                html_now=html2.format(line.ID_event, line.date, str(line.venue_name).encode("utf-8","surrogatepass").decode("unicode-escape", "ignore"), "Topics", Topic, int(mediandist), line.count_part)

                f.html.add_child(branca.element.Element(html_now))

                #f.add_child(legend)

                #f.html.add_child(branca.element.Element("<h1>Bacino d'utenza</h1>"))

                m1.add_to(f)

                iframe = branca.element.IFrame(html= '<body style= "background-color:#182534;"> </body>',width=1000, height=600)
                f.add_to(iframe)

                # Let's put the IFrame in a Popup
                popup = folium.Popup(iframe, max_width=2650)

                mc.add_child(
                    folium.Marker(
                    location = [float(lat), float(lon)],
                    popup=popup,
                    icon=folium.Icon(color="red",icon="fa-users", prefix="fa")#, size=(20,20))
                ))

    radius_events.add_child(mc)
    m.add_child(radius_events)
    plugins.Fullscreen(position='bottomright',title='Expand me', title_cancel='Exit me', force_separate_button=True
    ).add_to(m)

    #macro = MacroElement() #draggable legend just in case

    #macro._template = Template(template)

    #m.get_root().add_child(macro)
    #map.get_root().add_child(macro1)

    folium.LayerControl(position= 'bottomleft').add_to(m) #FIXME: fix position

    #m.save("hello1.html")
    return m
The map is built using folium API to leaflet.
View the full code here.